Two Weeks In: What the Data Told Me, and What's New in Your Dashboard

Two weeks after launching Receipt Tracker, only one person who used it in week one came back in week two. Here's what I did about it — and what's coming next.
Two weeks after launch, only one person who tried Receipt Tracker in its first week came back in its second.
It isn't a disaster — activation is healthy, and new people keep showing up. But it's the number that tells me whether this thing actually works, and this week, it told me it didn't. Yet.
Here's what I did about it — and what's coming next.
What the Data Actually Said
At launch I had 11 signups. Today I have 15, and 11 of you have scanned at least one receipt — a 73% activation rate.
So the AI scanning piece works. People show up, they photograph a receipt, they get back a clean line-item breakdown of what was inside their $223 supermarket run. That part of the bet — that local receipts could be reliably parsed by AI — paid off.
The harder number: of the people who actively used the app in week one, only one came back in week two. Everyone else scanned a receipt, saw the summary, and moved on.
That told me something important. Scanning a receipt is a one-time thing — you do it when you have a receipt in hand, and then you're done. If I want people to come back the next day, the app has to give them a reason that doesn't depend on them having just bought something.
So this week's work was about giving you that reason.
What's New on Your Dashboard
Open the app and you'll see three new things, all designed around one question: how are you actually doing this week?
A Running Comparison to Last Week
Under your weekly total, you'll now see a small chip that tells you whether you're spending more or less than the same period last week. Green down-arrow if you're under, red up-arrow if you're over. It's the first thing you see, because it's the question most people actually want answered when they open a spending app.

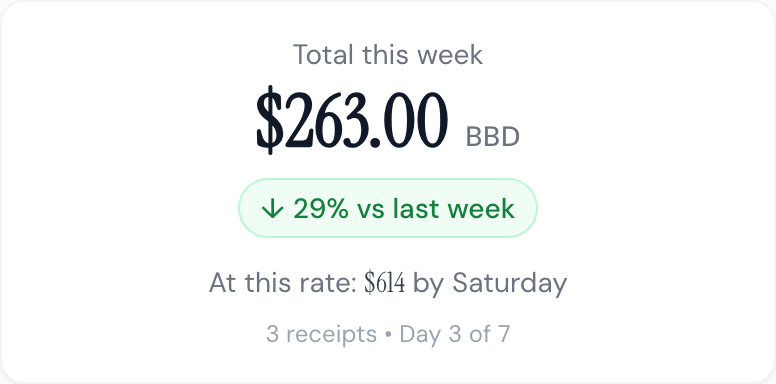
"At This Rate..."
Mid-week, the dashboard now projects where you'll land by Saturday based on your current pace. So if it's Tuesday and you've spent $263, you'll see "At this rate: $614 by Saturday • Day 3 of 7." You can decide if you're on track or if you need to ease off the takeout for the rest of the week.
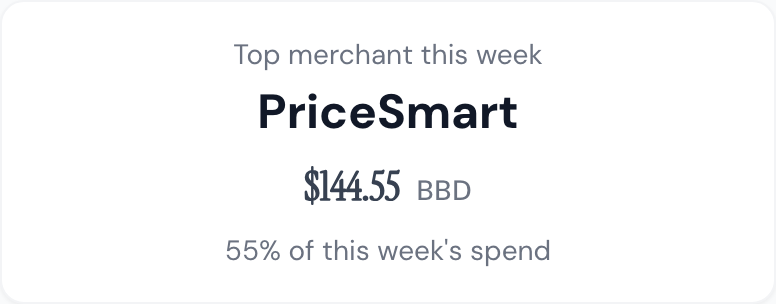
Your Top Merchant
The dashboard now highlights where most of your money went this week. One week it might be Massy, next week Chefette, the week after that Emerald City. It's a small thing, but seeing "55% of your spending was at PriceSmart" changes how you think about the week you just had.
I also opened the dashboard on week view by default. Before, it defaulted to the current month, which meant the numbers only changed once every four weeks. Now the picture refreshes every seven days, and the comparisons feel alive.
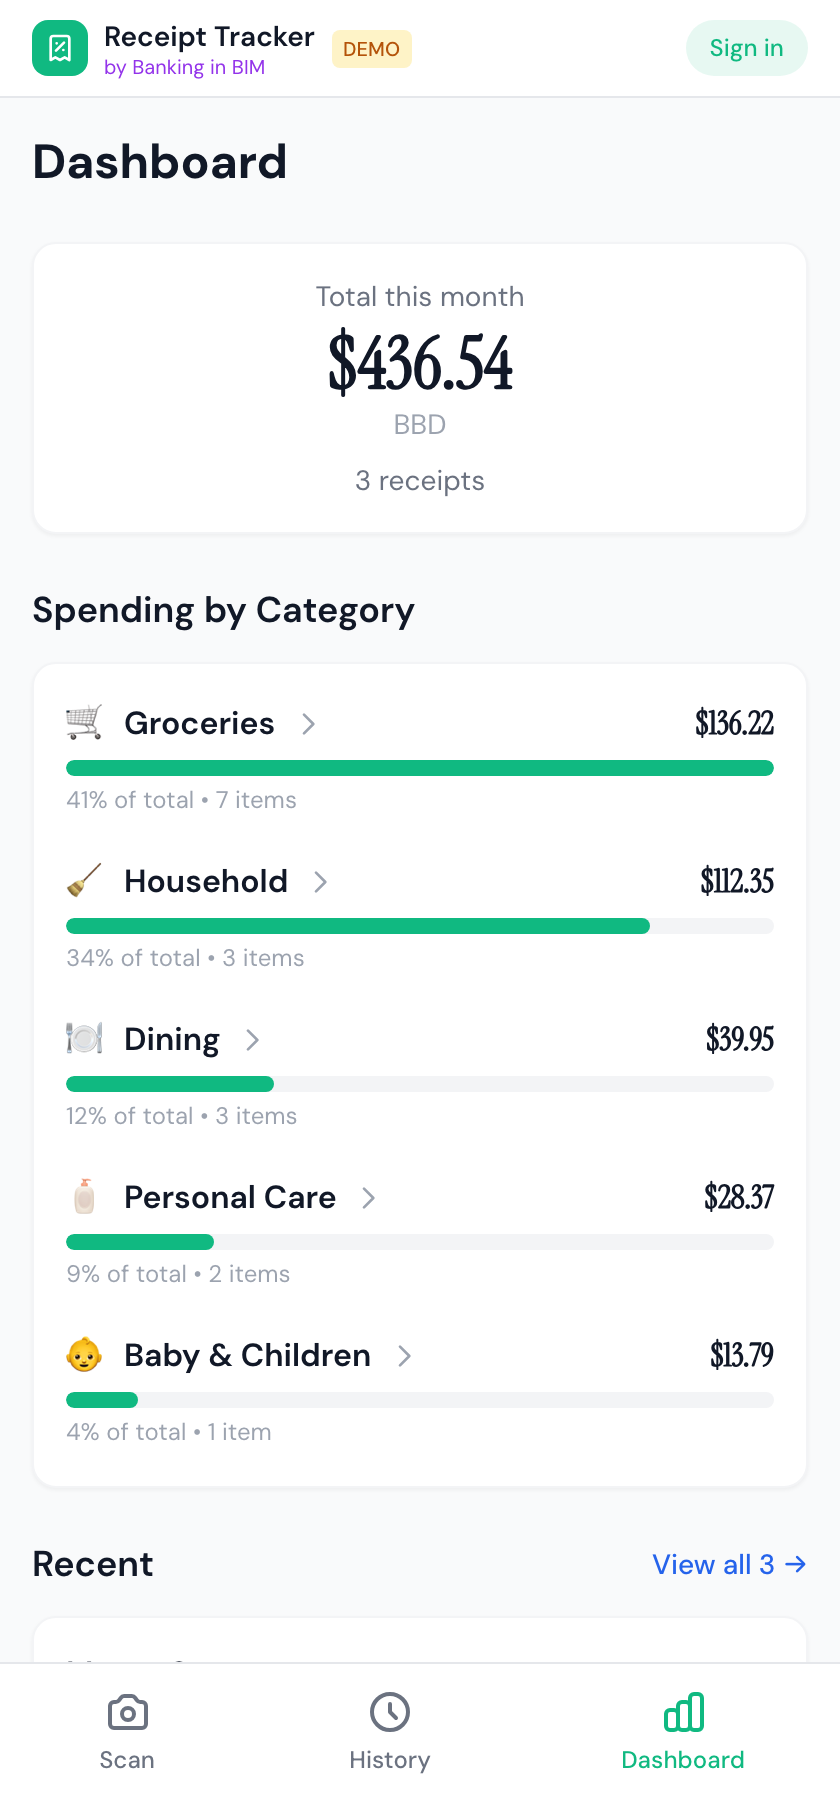
Before: month-default dashboard with just a total and categories.
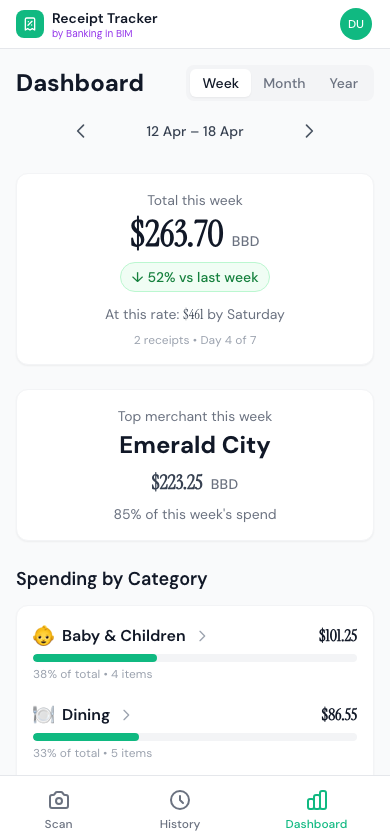
After: week-default with comparison, projection, and top merchant.
What's Coming Next
This week's changes are one bet on what brings people back. Here's what's next on the roadmap if it works.
Spending targets. Set a limit per category — say, $500/month on groceries — and watch your progress against it. The dashboard already tells you your pace; targets give that pace something to aim at.
Price-per-unit tracking across stores. Every weighed item on your receipts already has a unit and a price. The next step is showing you the trend: "Drumsticks: $19.95/kg at Massy vs $17.50/kg at PriceSmart" or "chicken is up 12% this month." For anyone serious about the food budget, this is the one I'm most excited about. There's nothing else doing it for the Bajan market.
What I'm Watching
The next thing I'm measuring isn't a feature. It's whether this week's changes actually bring people back. In a week, I'll have cohort data for everyone who's been here since launch and I'll know whether the new dashboard moved the needle.
If it did, I'll keep building on the web app — spending targets, price tracking, and the rest of the roadmap.
If it didn't, there's a harder conversation to have about whether Barbadians want a spending tracker in the browser at all, or whether it belongs somewhere else entirely — like WhatsApp, where you'd just send a photo of your receipt and get the breakdown back. I'd rather make that call with data than with my gut.
If You've Tried the App and Drifted Away
No hard feelings. But if you're willing to say a word about why, I'd genuinely love to know. Reply to this post, DM me, or drop a note in the in-app feedback. The fastest way to build something worth using is to hear from the people who tried it and weren't won over yet.
And if you haven't tried it: app.bankinginbim.com. Scan two receipts for free, no sign-up needed.
Thanks for being here at the very beginning. More soon.
Questions about this topic?
Financial terms can be confusing. If you have questions about the article or ideas for what I should cover next, send me a DM.
Chat on Instagram